
The verifiable analytics platform for business data.
Turn scattered business data into trusted Insights your whole team can act on.

Flexible like a Chatbot. Reliable like a Data system.
A chatbot can't show its work
You get a confident answer and no way to check how it got there

A dashboard can't take a question
A wall of charts, frozen the day it was built. Ask something new and you're stuck.

Anvifo solves both fallbacks
Every answer comes with the query it ran and the rows behind it
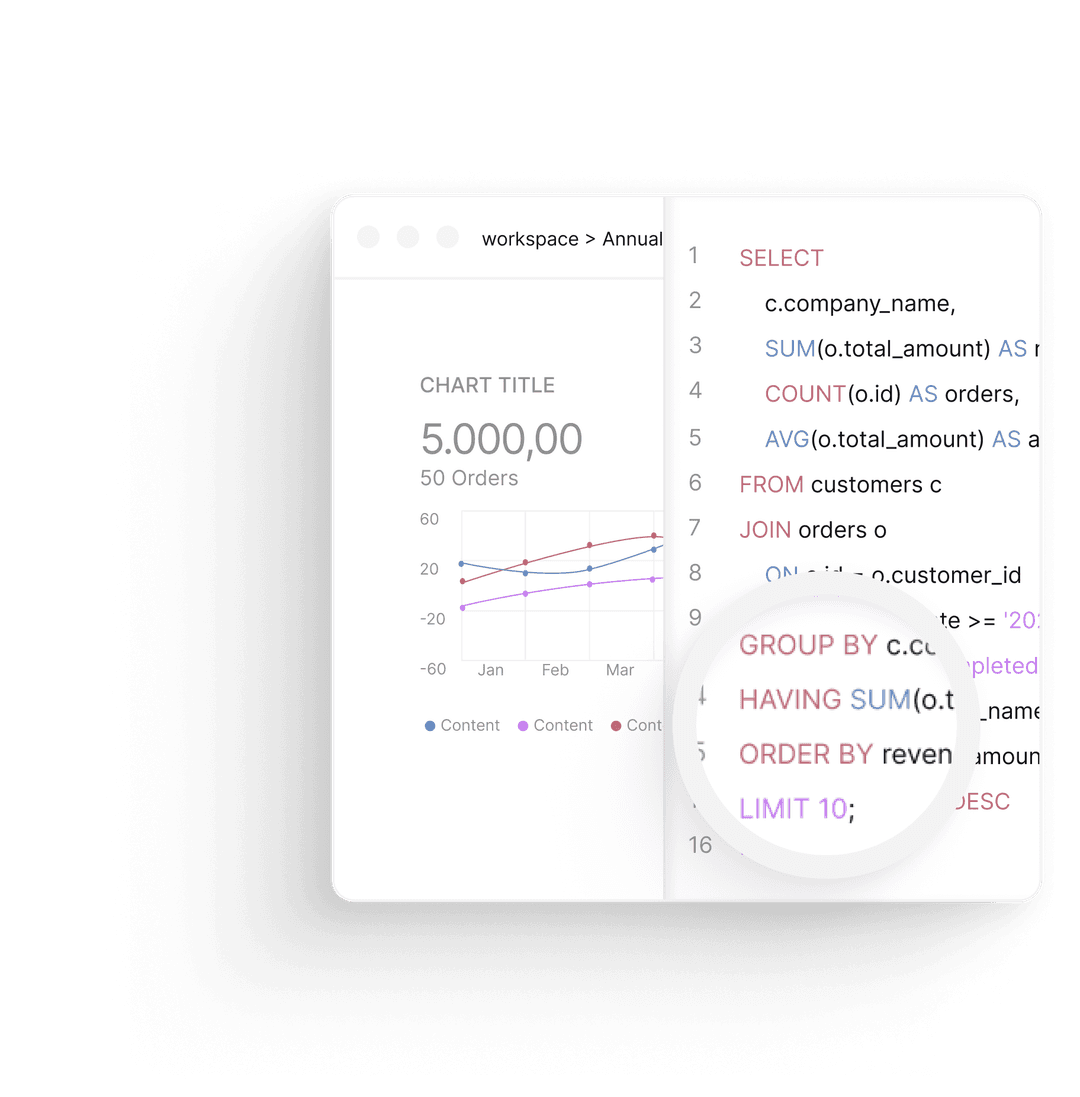



Upload your data from multiple sources.
You can drop a CSV or connect your database. That's all it takes to get started.

Anvifo cleans your uploaded data.
It analyzes your file, detects column types, and fixes the messy bits.

Ask, and get clear insights
Answers are grounded in your data and your rules not on generic assumptions.

Pin, present, or share
Turn any answer into a live dashboard, full-screen slides, or a shareable link.
Everything you need to trust your data.
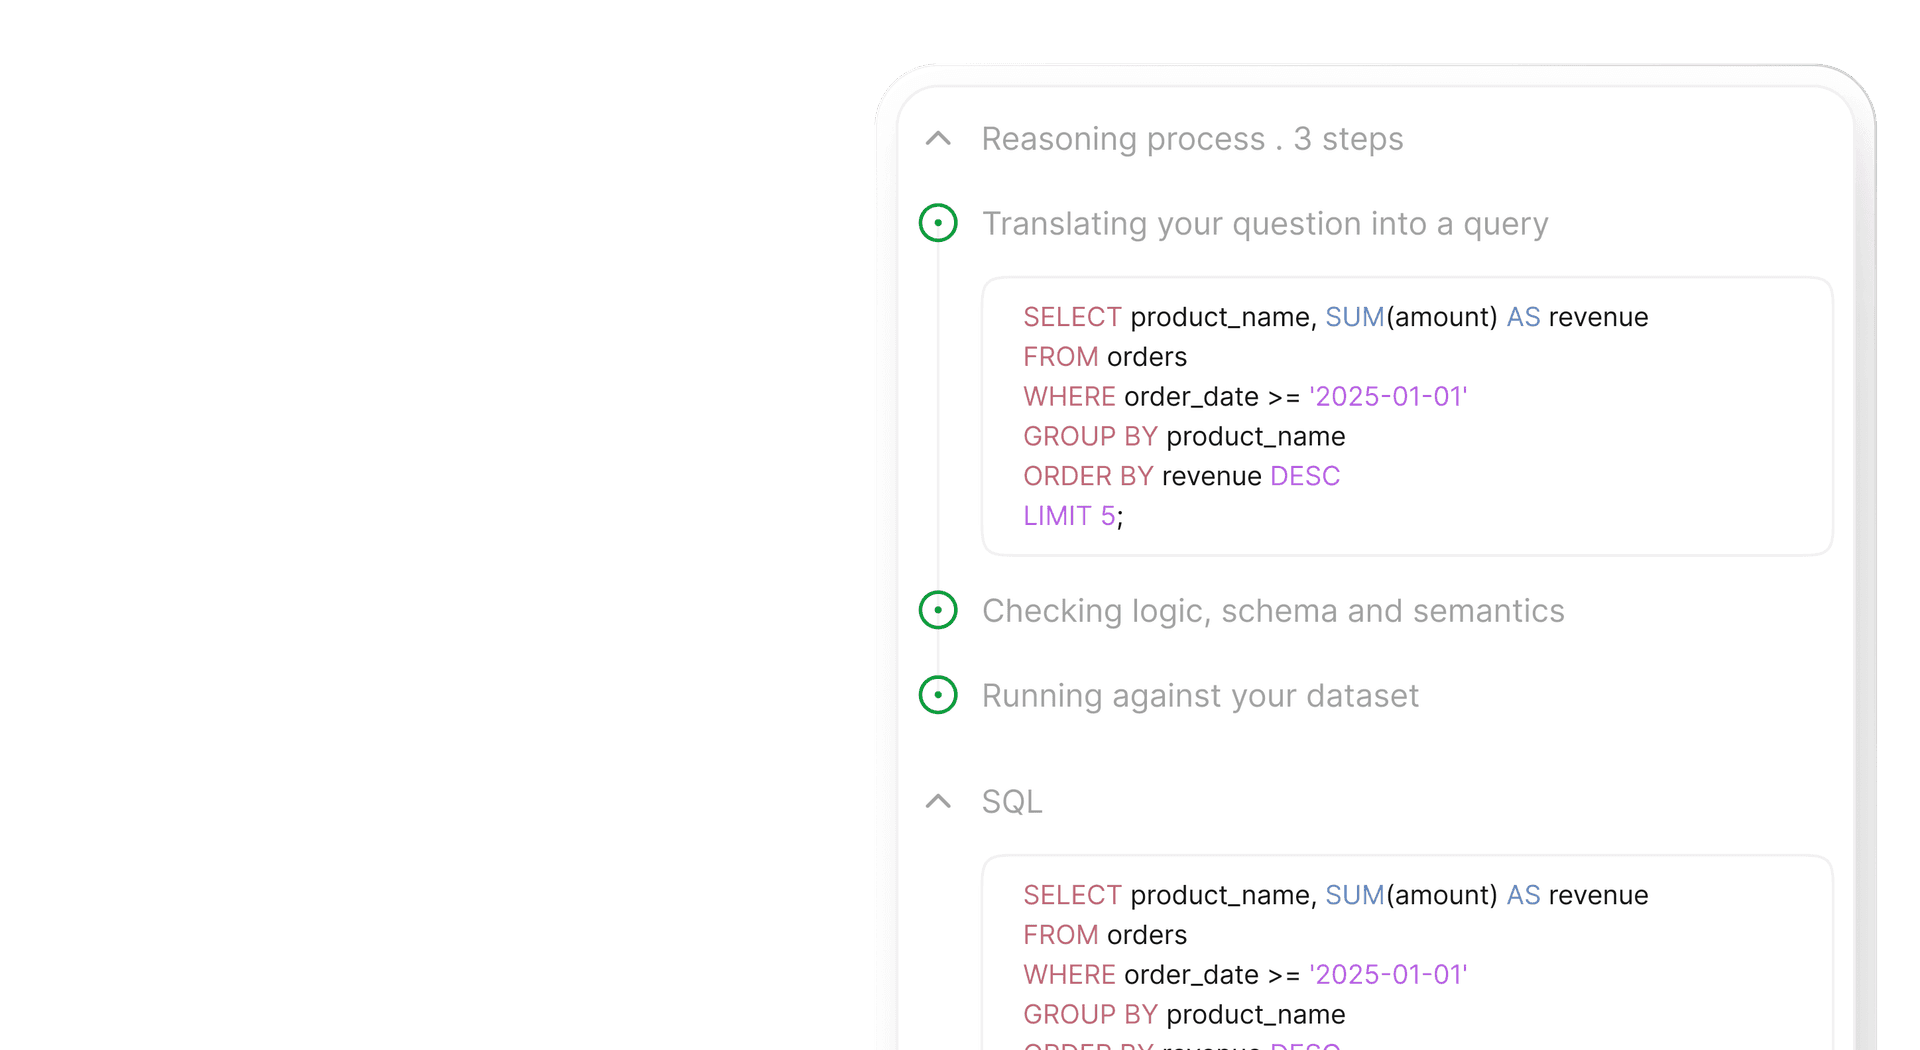
Answers you can trust
Never present a number that's quietly wrong: Anvifo validates every answer and flags low-confidence results before you act on them.
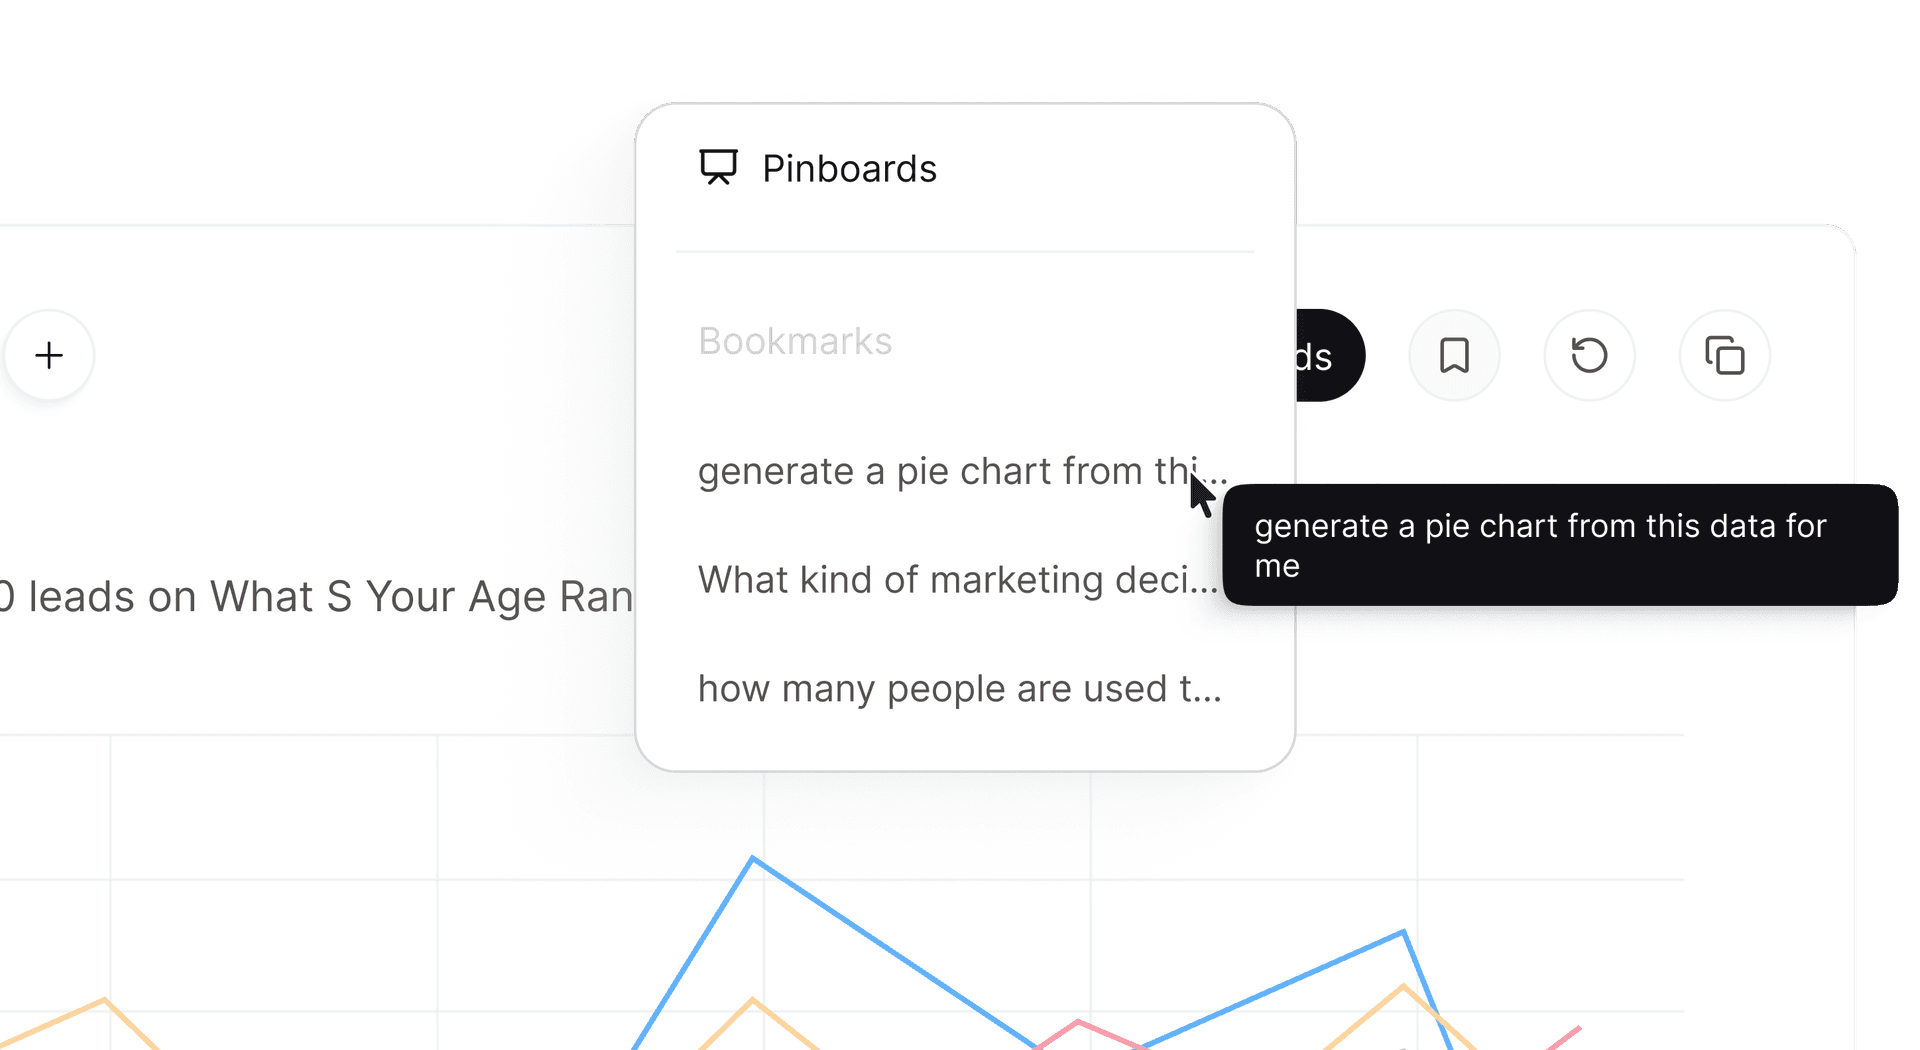
Your work is saved
Never redo an analysis. Every question you ask is saved with its result, ready to reopen months later exactly as it was.
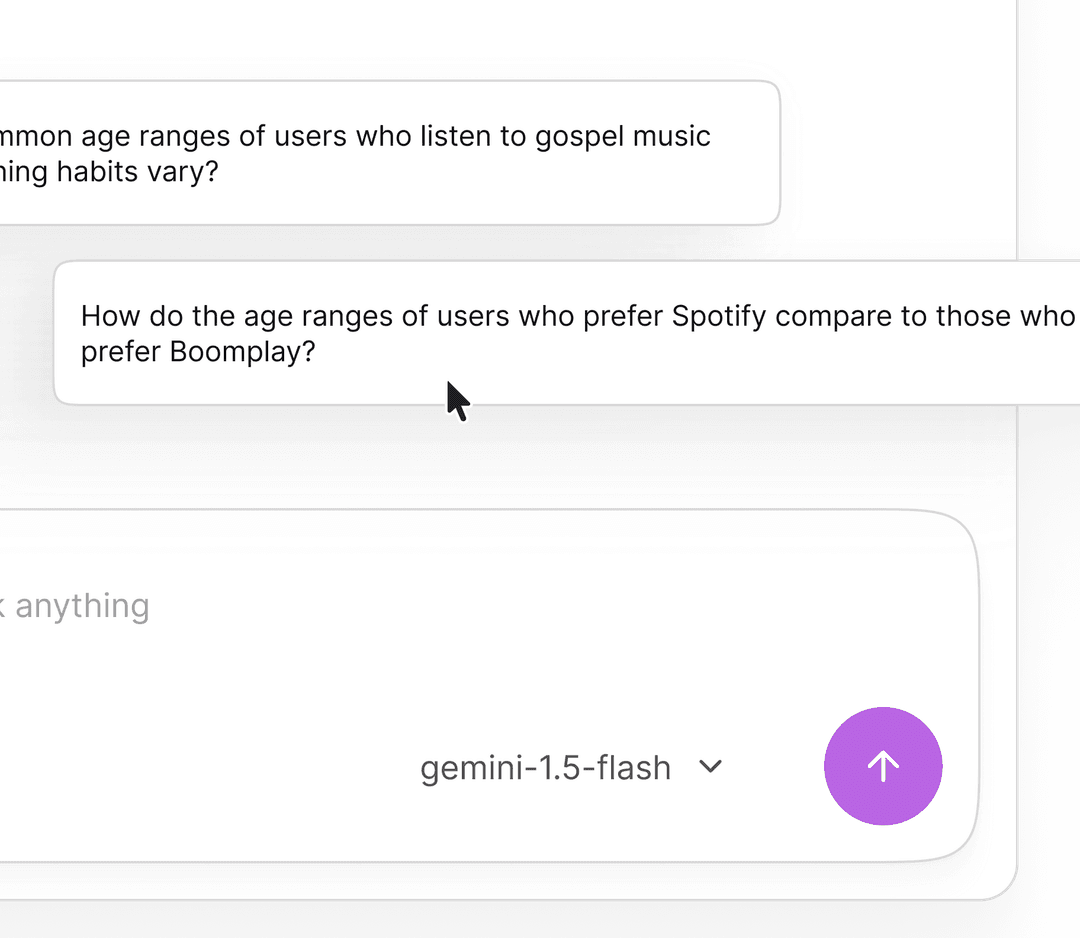
Smart follow-up questions
Uncover what you'd have missed: every answer comes with the smart next questions you didn't think to ask, so one query becomes a real investigation.
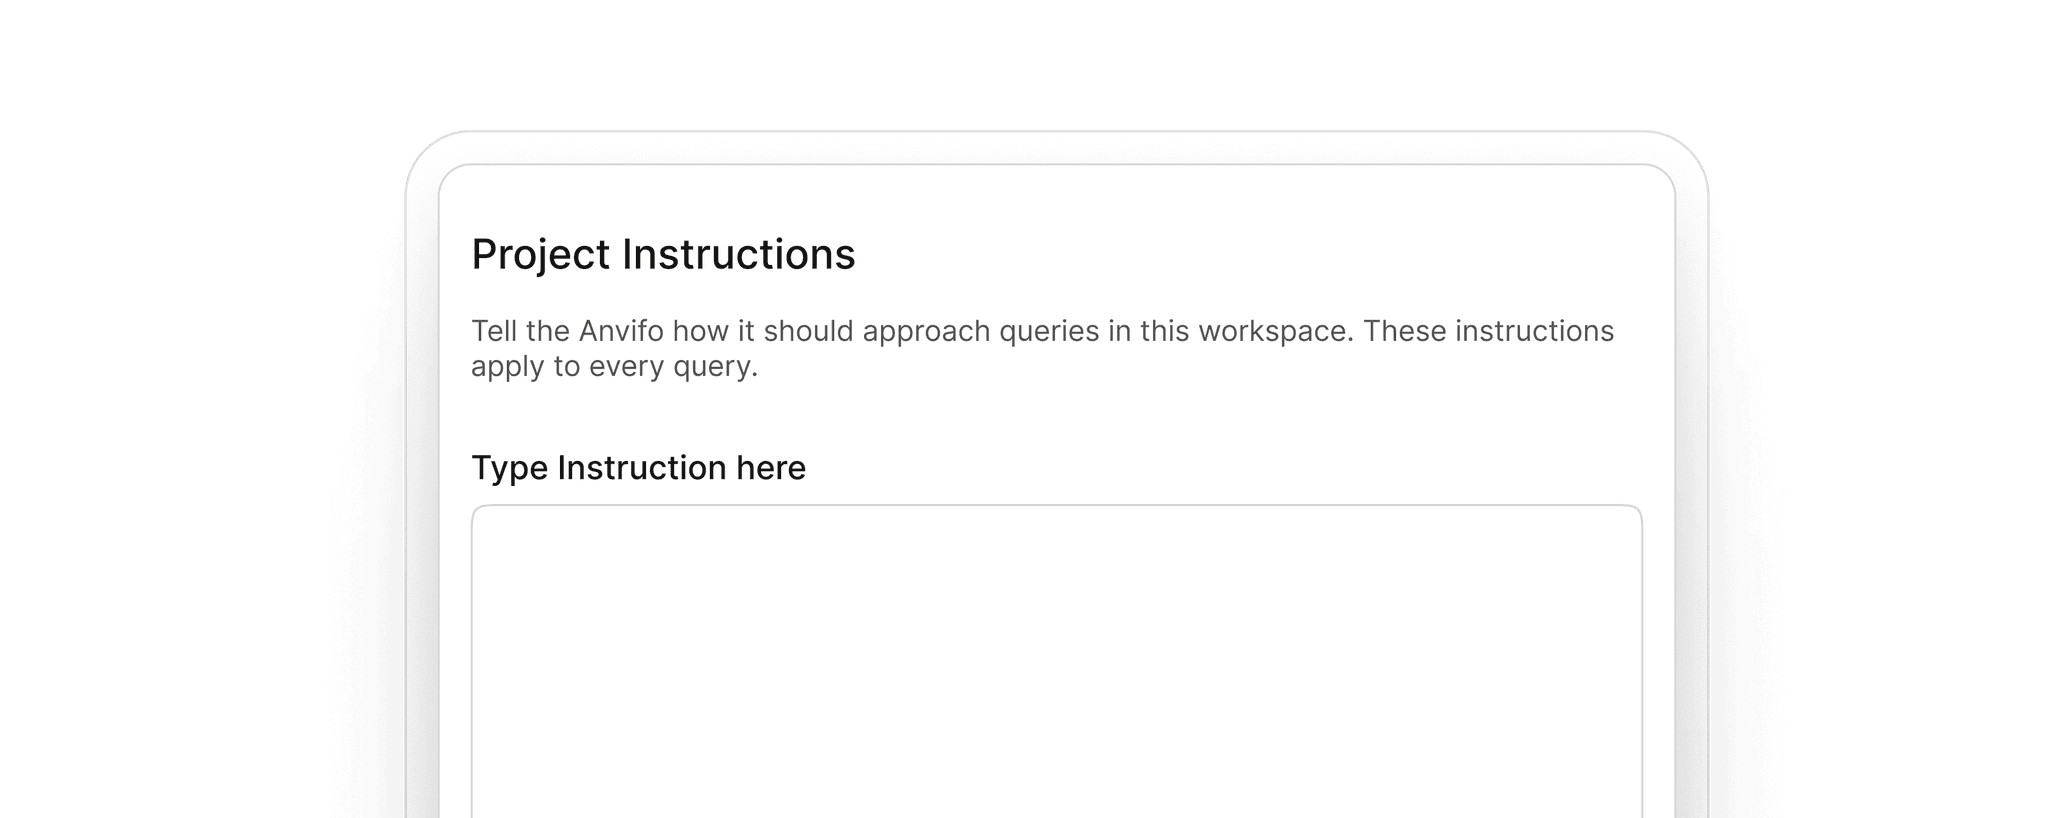
Standing instructions
Tell Anvifo how your business works once; standing instructions and context every future answer respects.
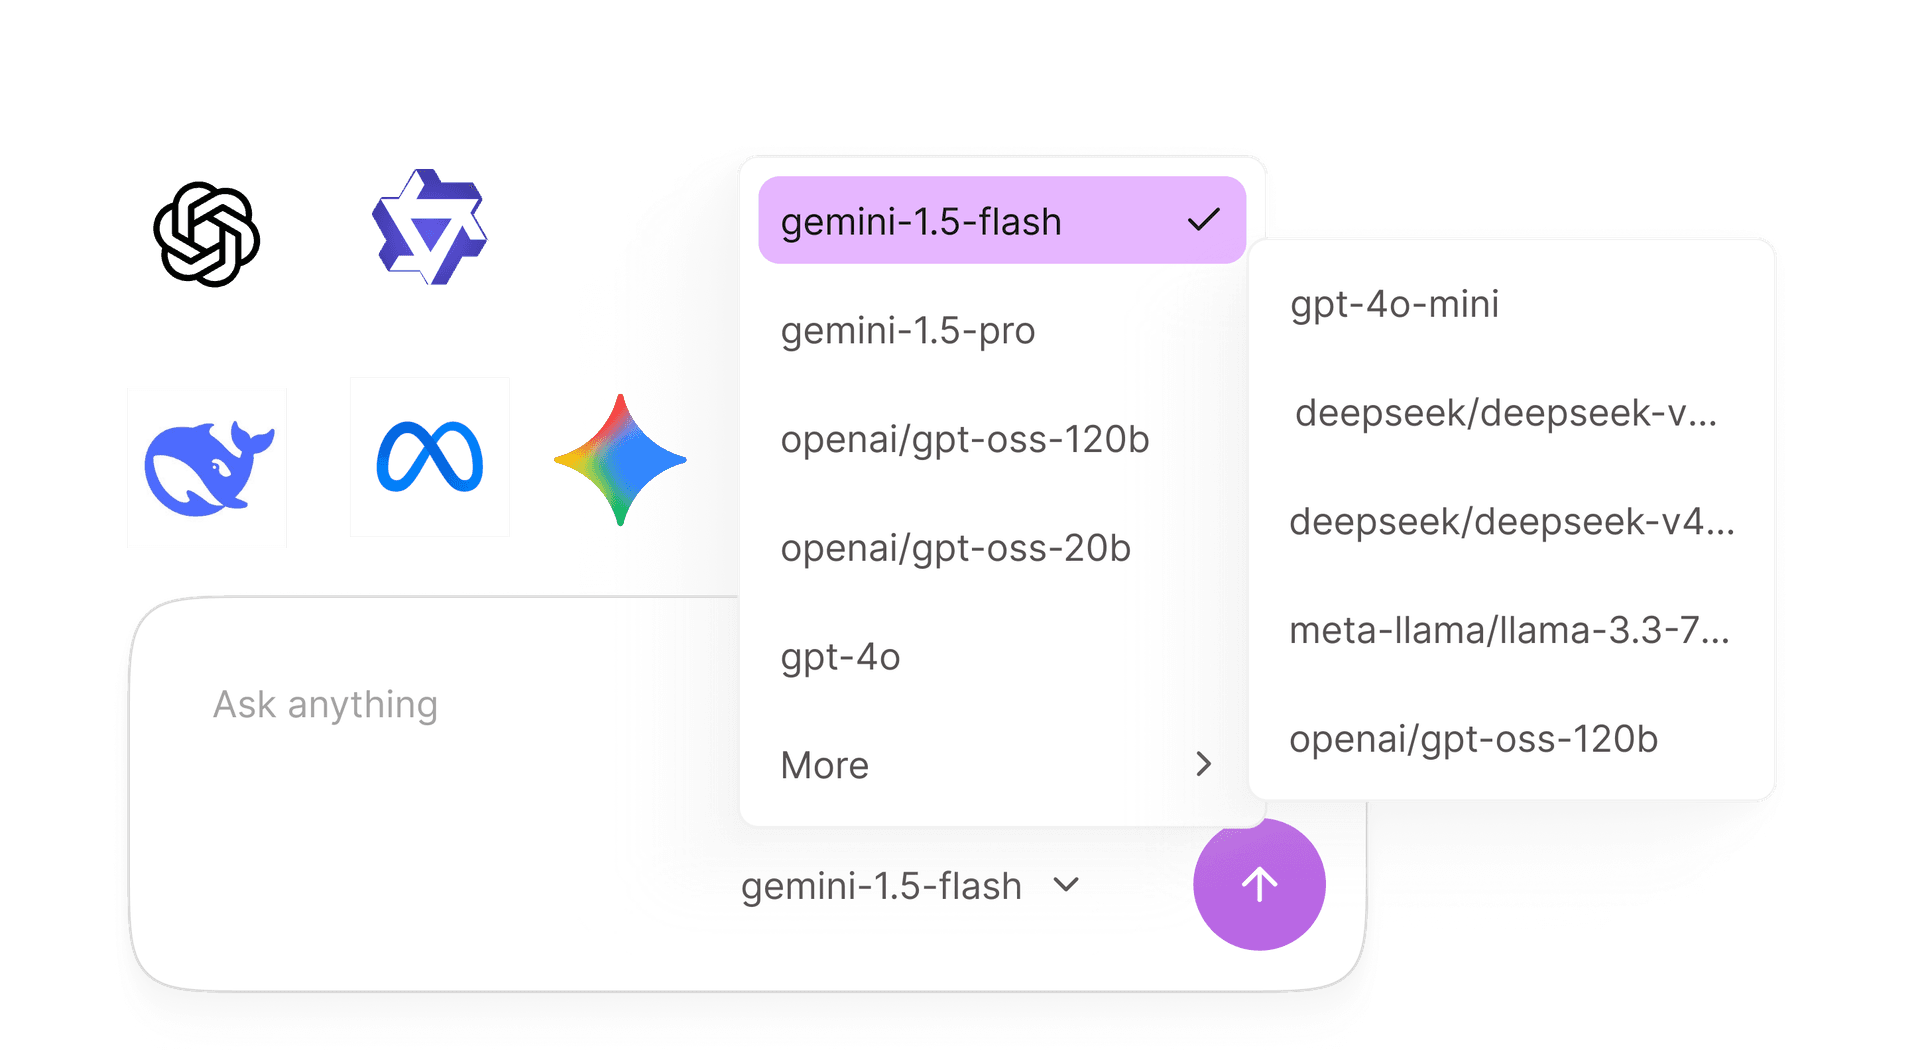
Use any model
Route your questions to Gemini, OpenAI, or Groq for your queries, whichever fits the job.
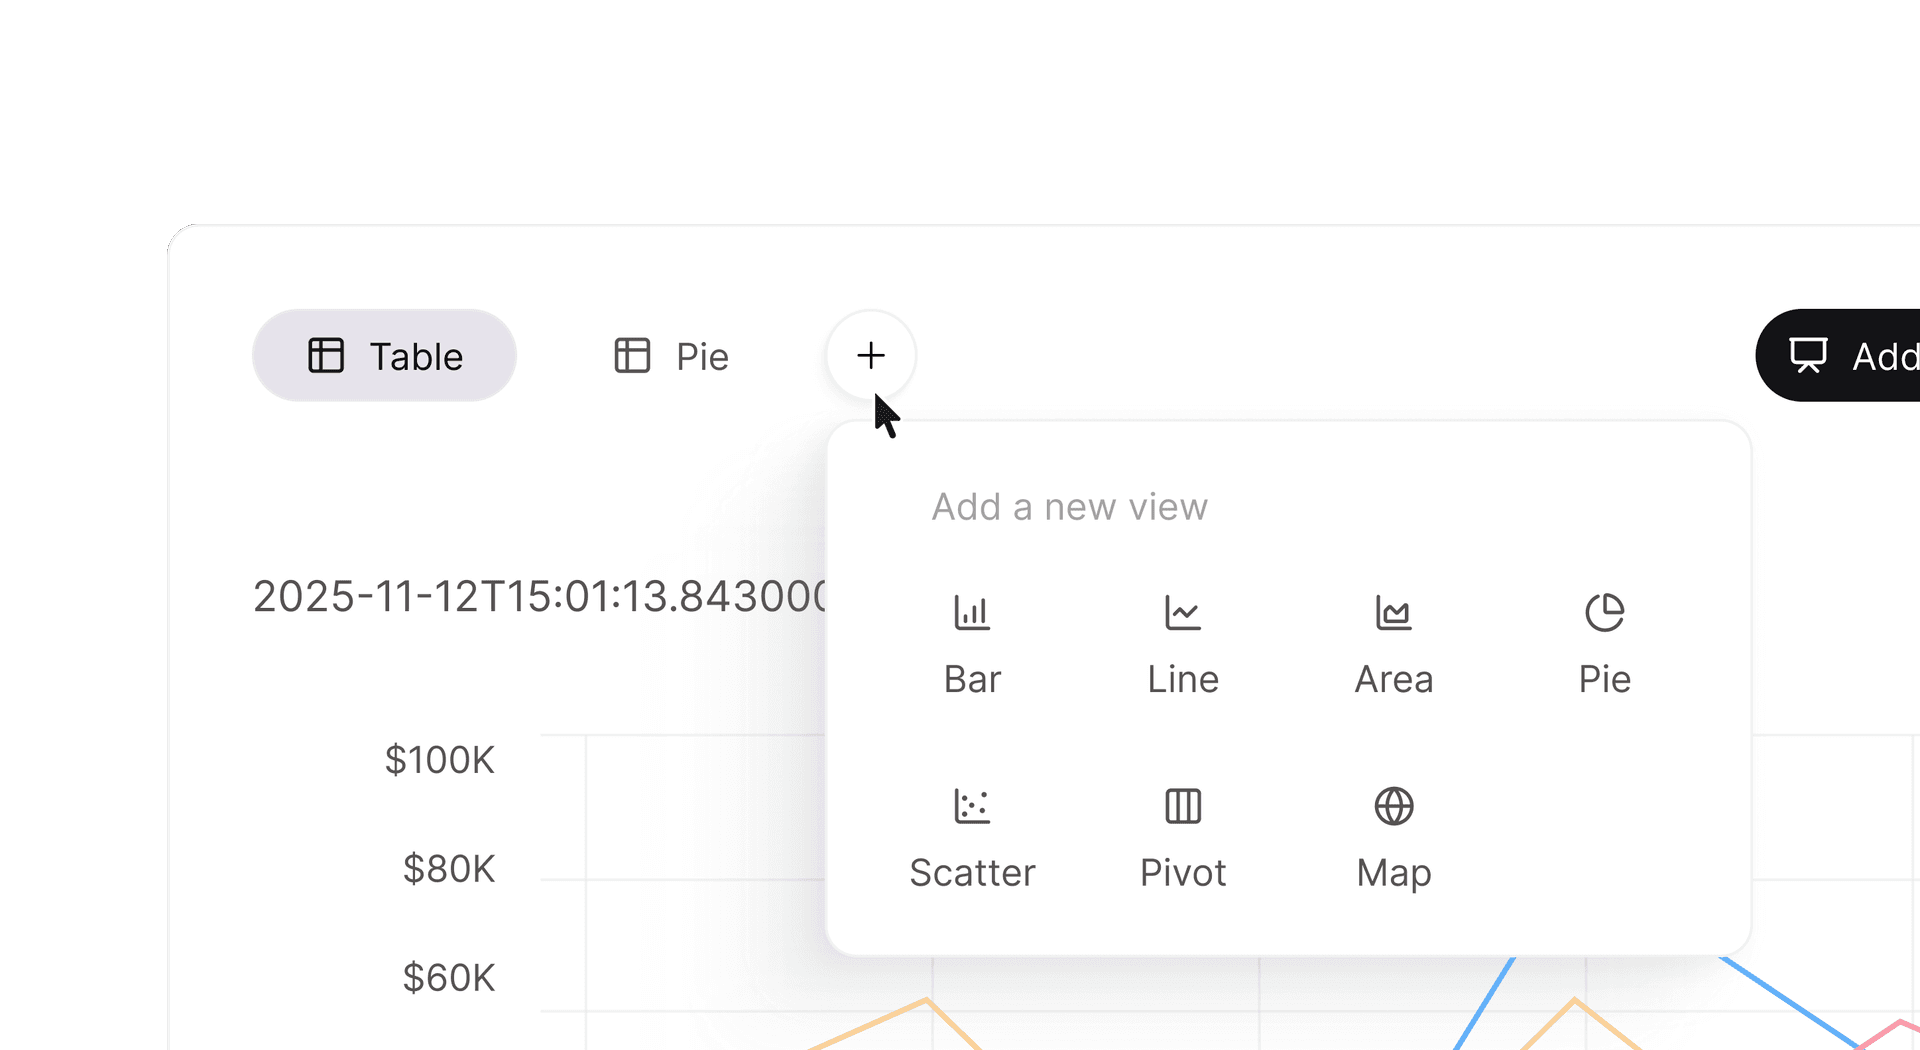
See it every way
Explore a result from every angle: turn the same answer into a chart, a table, or a map, and add as many views as you want.
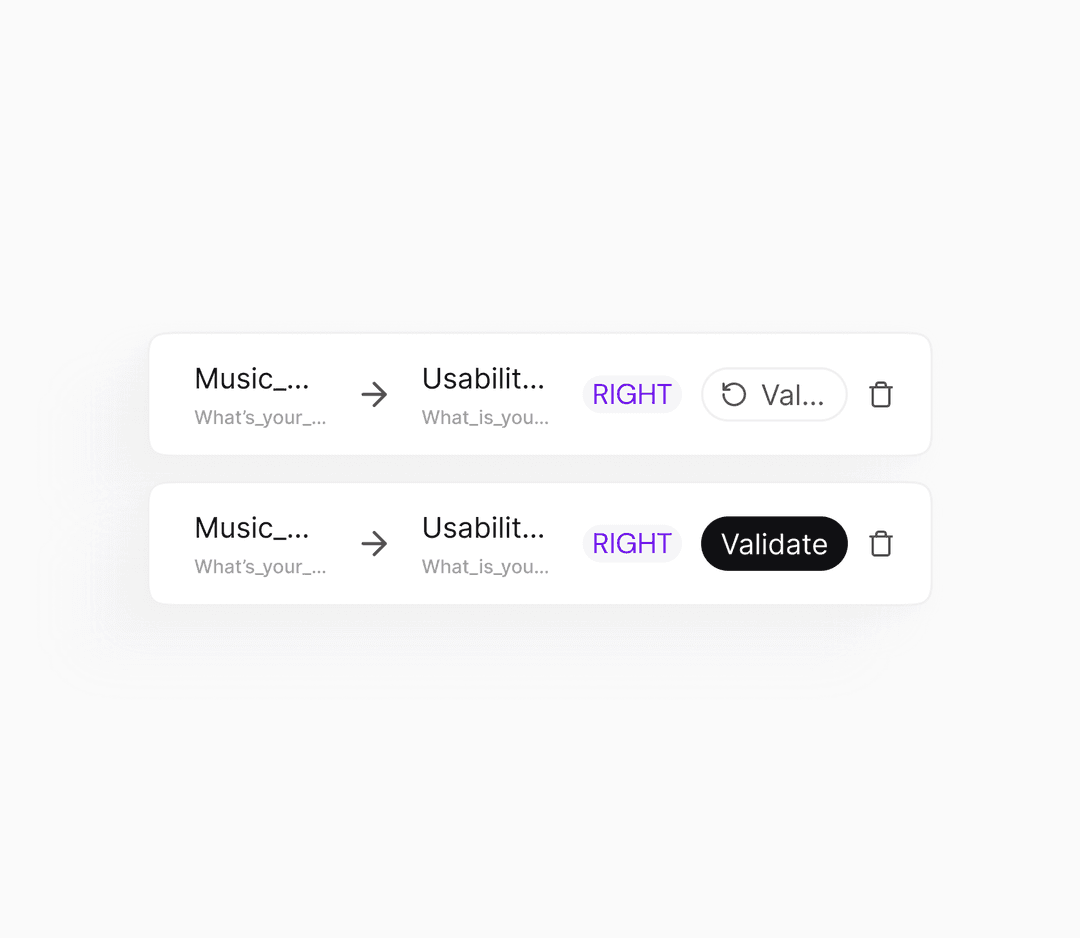
Query across datasets
Ask questions that span your datasets with confidence. Anvifo suggests how tables connect and validates the joins on real rows.
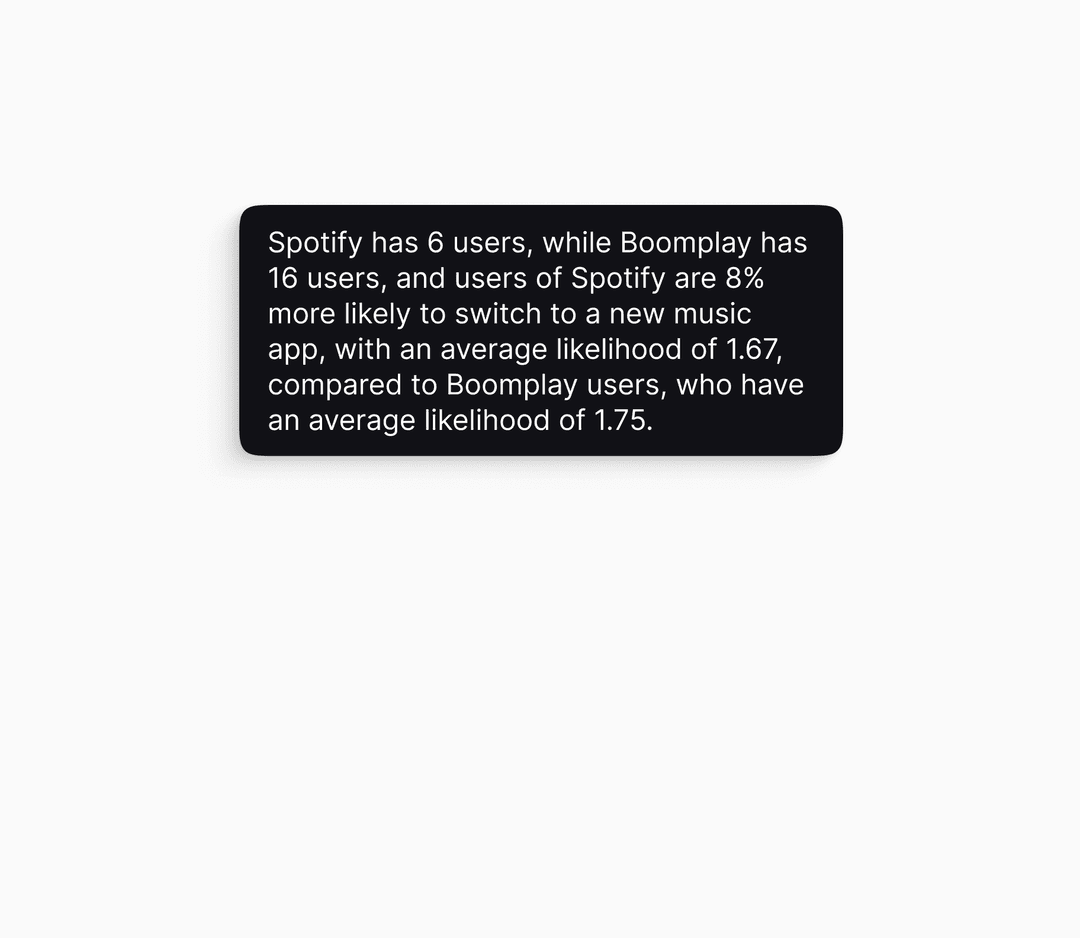
Summaries & AI insights
Every result comes with a plain-language summary and an AI insight.
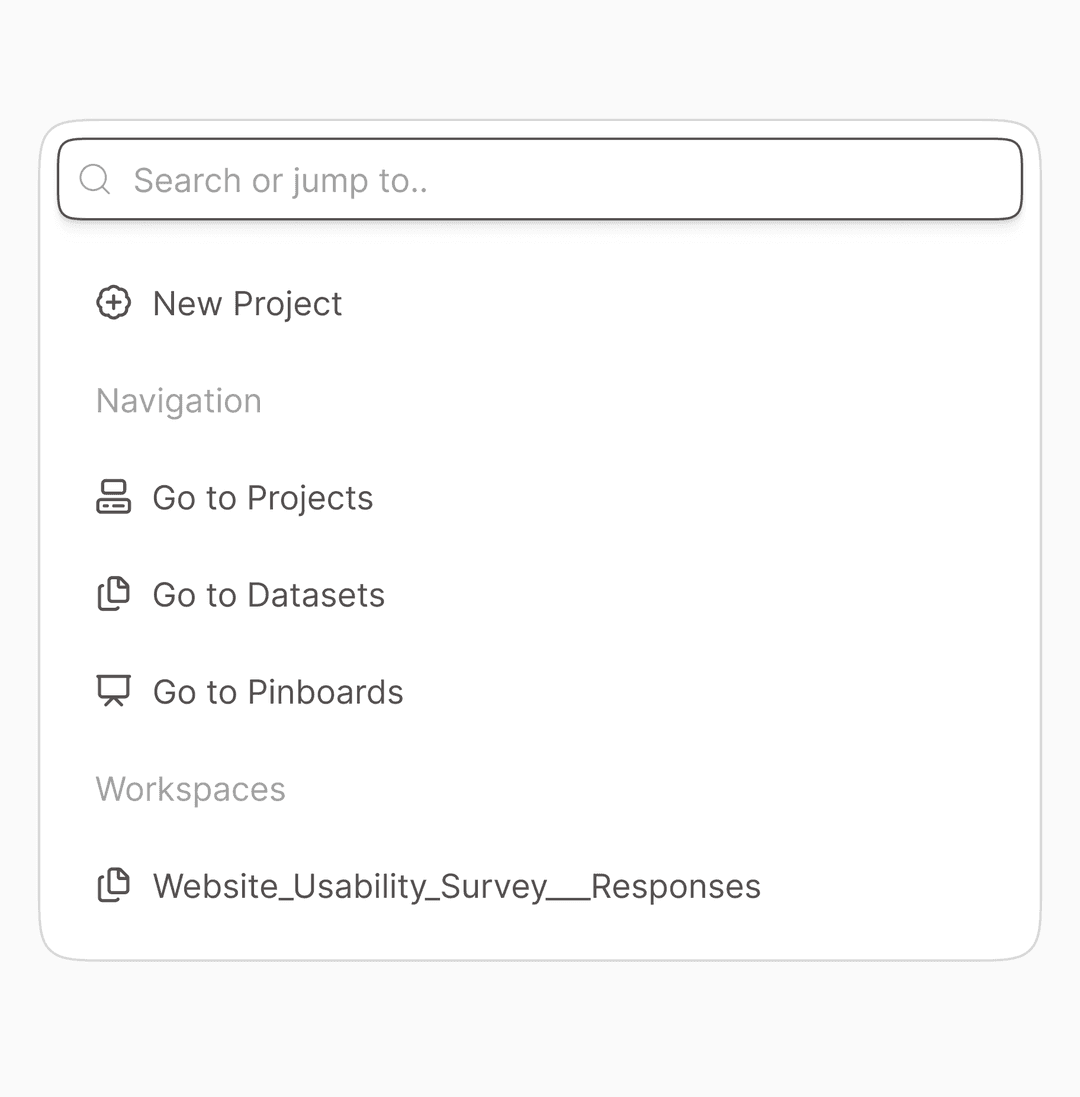
Keyboard-first control
Drive the whole workspace from the keyboard, search, navigate, and run actions.
Try Anvifo now.
Join modern teams replacing dashboards with conversations.